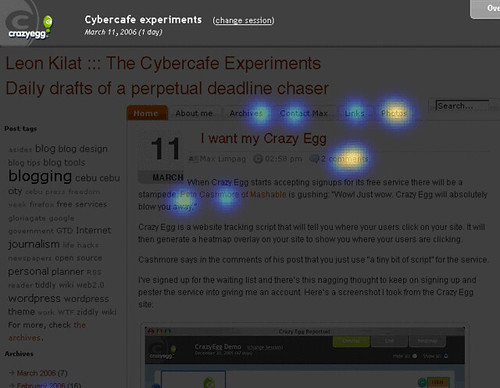
There are a lot of excellent blog metrics services out there and most of them are either free or offer free account packages. I have used six in this site, not because I am obsessed with going over the low visit count of my blog but because I’m writing about these services for a special section I handle. I drafted this post two weeks back when I was still using a different blog template so the screenshot below of the Crazy Egg data is no longer current.
Here are the services I use or have used, ranked according to my level of satisfaction in using them. Most of the screenshots were taken a few hours after I signed up for their services.
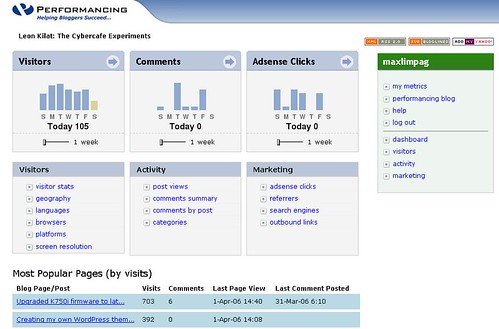
1. Performancing Metrics
The free blog metrics service by Performancing.com, a very informative community for bloggers, is probably the best metrics service for blogs. It tracks data you’d expect an acceptable blog metrics would track–number of visitors, browsers, screen resolution, blog post views–and more: AdSense clicks and on which pages the ads were clicked and RSS feeds for the statistics. Performancing Metrics also allows you to track multiple blogs using a single account.
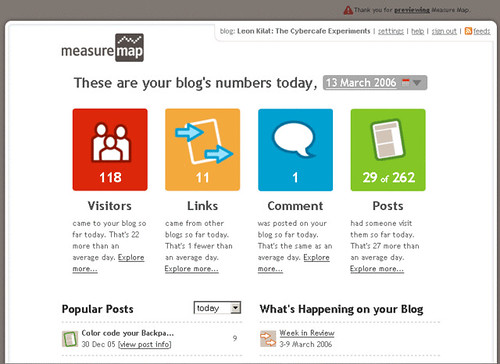
2. MeasureMap
Before Performancing Metrics, MeasureMap was the best free metrics service for bloggers. MeasureMap is still not offering new accounts. MeasureMap has a better interface than Performancing Metrics, offers RSS feed for data and has a more visually pleasing data presentation but I placed it on second place because 1. it doesn’t provide data on visitors’ screen resolution, 2. it doesn’t track AdSense clicks, 3. it is more complicated to integrate into a blog design because you have to enter three pieces of code if you’re using WordPress and this can be a pain if you frequently change design like I do. Performancing, on the other hand, does its job with just one chunk of code.
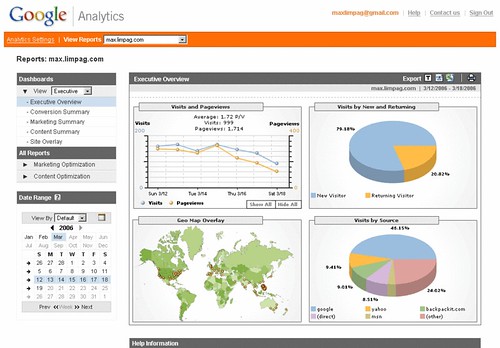
3. Google Analytics
Google Analytics isn’t a blog-specific metrics solution. It is a free website metrics solution that came out of Urchin. It offers a lot of data from traffic referrals to number of visits and pageviews to the ratio of new readers to returning readers to visitor loyalty-the number of visits done by website readers. I haven’t been going through my Google Analytics data because either Performancing or MeasureMap or Site Meter is usually enough to give me a picture of my site’s traffic.
4. Crazy Egg
Crazy Egg is a different type of metrics system as it monitors where your readers are clicking and superimposes this on a screen grab of your website design. It also generates a heatmap that will show you where your readers are clicking. Yes, some of these data are intuitive: readers click on menu items, for example, but it helps you spot interface items ignored by readers. Crazy Egg data have helped me a lot in design decisions. Crazy Egg is free but is still in limited beta.
5. Site Meter
Site Meter is the blog counter service I have used for the longest time. It is free, easy to useand provides you the important web traffic data you need: how many people visit your site, how they got to it, how many pages they viewed and how long they stayed in the site. It now tracks the links readers click to leave your site. Site Meter is the blog traffic monitor I check first. It is only when I want to go to specific blog traffic data that I use either Performancing or MeasureMap. (No screenshot of Site Meter, I’m sure you’re familiar with it. If you haven’t tried the service, click on the Site Meter button in this blog.)
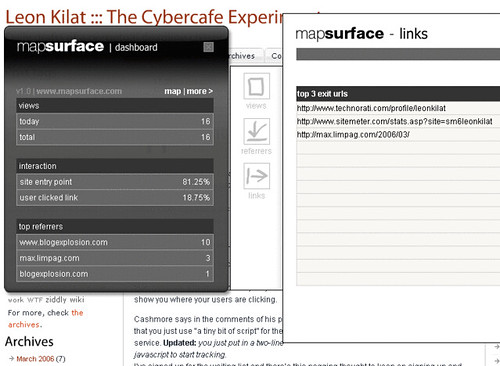
6. Map Surface
Map Surface tracks how people got to your site and which links they click to leave it. It offers less traffic data than Site Meter and less user activity data than Crazy Egg so if you’re using Crazy Egg and Performancing or Measure Map or even Site Meter, you can just turn this off. Map Surface data is public and you can just press ALT + X to load and check the data collected by Map Surface for the page. Try it at the Map Surface site.
Max is a journalist and blogger based in Cebu. He has written and edited for such publications as The Freeman, The Independent Post, Today, Sun.Star Cebu, Cebu Daily News, Philstar Life, Esquire Philippines, and Rappler. Max is an Aries Rufo Journalism Fellow for 2024.
He is also a mobile app and web developer and co-founded InnoPub Media.

Leave a Reply